Company Blog

Posts Tagged ‘chris mueller’

Heatmaps for Twitter

January 26th, 2009 by Chris Mueller

Today we are announcing the release of a new version of The Word on the Tweet, our Twitter/map mashup. With this version, we are generating heatmaps (or density maps) of words as they are tweeted around the globe.

For example, here are maps for the words “love” and “hate”:
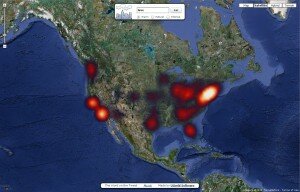
Tweets containing the word "love"
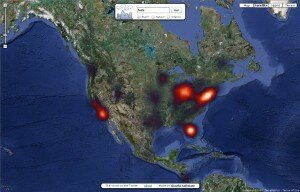
Tweets containing the word "hate"

Note that the maps generated using this service are based on a sampling of the Twitter public timeline, which itself is a sample of all Twitter traffic. The data is not up-to-the second in accuracy, but will reflect the general trend over the past several weeks. Some words or brands that are more uncommon may not be available yet.

Double-clicking on a location brings up a word cloud and a selection of the most recent tweets from that location:
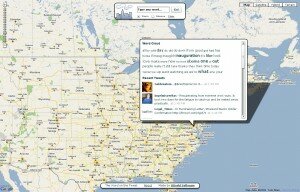
Word Cloud and Recent Tweets

Word Cloud and Recent Tweets for Washington, DC

There are many fascinating patterns to be discovered. Pan the map, zoom, search in multiple languages. Enjoy!

Launch the Word on the Tweet

PS: the original version of the Word on the Tweet is still available.

The Word on the Tweet

December 9th, 2008 by Chris Mueller

We recently built a tool to help us understand what people were saying at a specific location. It’s a first draft (beta) version. Take a look:

Launch The Word on the Tweet

We combined a Google Map with the Twitter API to discover words that were common to a place. When you click on the map, we pull the top 40-50 words from Twitter within a 25-50 mile radius. The service works best in English.

Some interesting trends from the past couple of days:

  • San Diego: Jet, F18, crash
  • Kansas City: Snow
  • San Francisco: Confessions
  • Washington DC: Obama, Blagojevich
  • Dublin: Beef, pork
  • Liverpool: Xbox, dashboard
  • Baghdad: Vacation

What can you discover? Feel free to send us your comments about The Word on the Tweet.

KML for the 2008 Presidental Elections

November 10th, 2008 by Chris Mueller

We have collected and processed election results by county for the 2008 US Presidential elections. KML files depicting the elections are available here:

  • Percent votes Democrat, by county. (KMZ)
  • Percent votes Republican, by county (KMZ)

These files can be downloaded directly into Google Earth or other geo-browsers.

2008 Election Democratic Counties in Google Earth

Democratic Counties

Republic Counties

Republican Counties

If you run Windows and have the Google Earth plugin installed in your browser, you can also view the or KML files in EarthAtlas.

Please note that we currently do not have results by county for Alaska. This data was collected as it was posted by major media outlets. Some county-level data in the Northeast is approximated from preliminary town-level reporting. Also, we are aware of about ten towns and cities across the country that are not properly represented in these KML files.

For full election coverage and data sets, we recommend Dave Leip’s US Election Atlas. He provides very high quality election data packages and any data purchased from the Atlas can be loaded into UUorld.

World Airports

October 17th, 2008 by Chris Mueller

While browsing through our data collection, I found myself more and more intrigued by the world airports statistic. From the sparklines on this summary page, it’s clear that some country is an outlier. By a full order of magnitude, the USA has more airports than every other major country, aside from Brazil. Let’s take a closer look.

My first encounter with the airports data was in Africa, where we see that South Africa has far more airports than any other African nation:

Airports in Africa

Then I turned to Asia, where I was surprised to see just how few airports were in China and India, in spite of their massive populations. In China, my suspicion is that the population is concentrated in the eastern cities, and, in general, the population is less mobile than that in other countries. (A bit of searching on Google suggests that China is investing heavily in their air infrastructure, and one source predicts 100 new Chinese airports in the next 10 years.)

Airports in Asia

When we zoom out to the global view (see below), it is instantly clear how the United States dwarfs other countries on this statistic. It is easy to speculate on the reason why the US has such a high number of airports: a high GDP, plenty of money for a luxury like air travel, the legacy of the Wright brothers, etc. Brazil is in second place with about a third of the number of airports of the US; Russia has about a tenth of the number of airports, and every other country has far fewer:

Curious to learn more about the distribution of airports in the US, I stopped at to pull their statistics on the number of  airports by state (below). The data I loaded shows both private and public airports. In this image, I zoomed in on the continental US, but I should note that Alaska has 732 airports and Hawaii has 54 airports.

USA Public and Private Airports by State