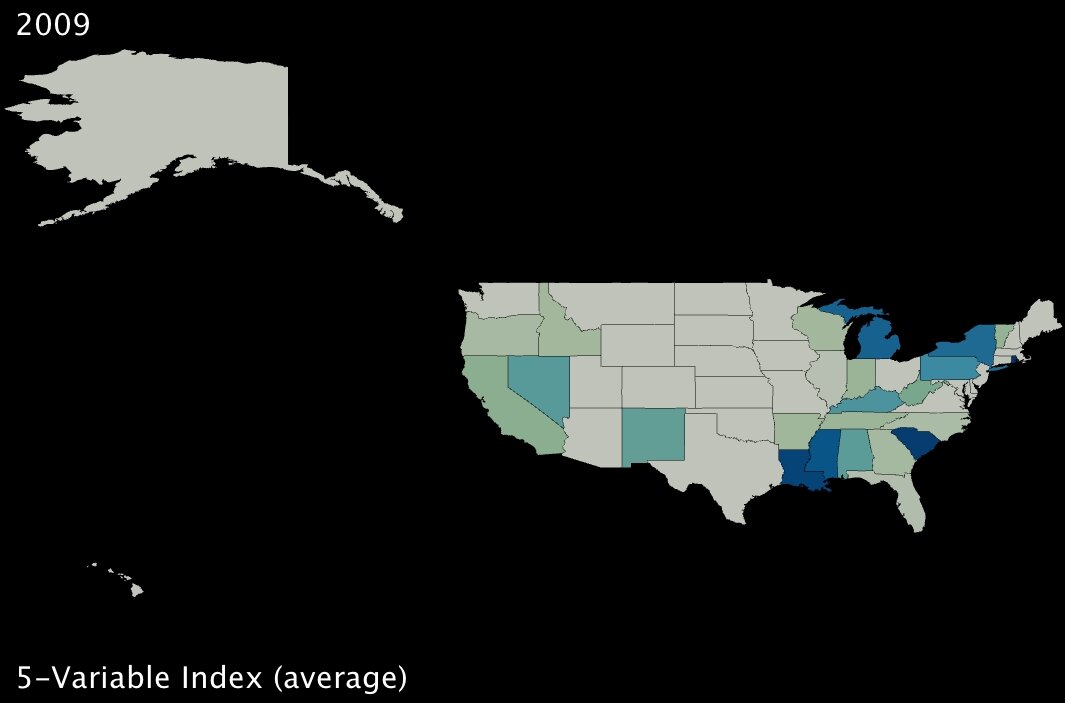
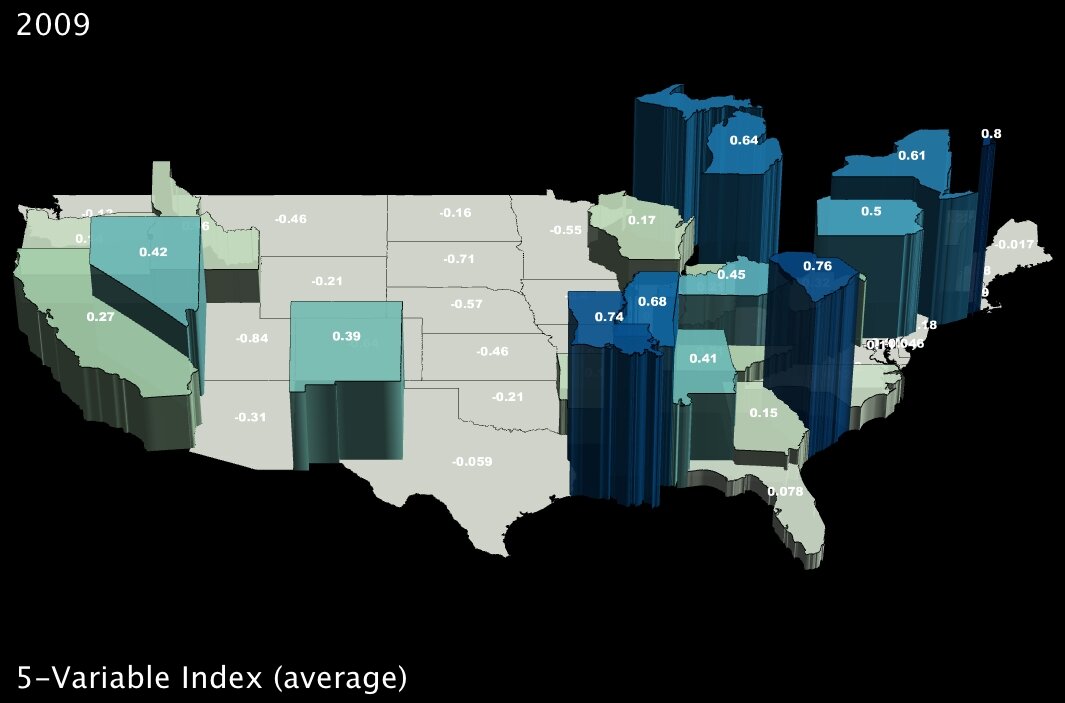
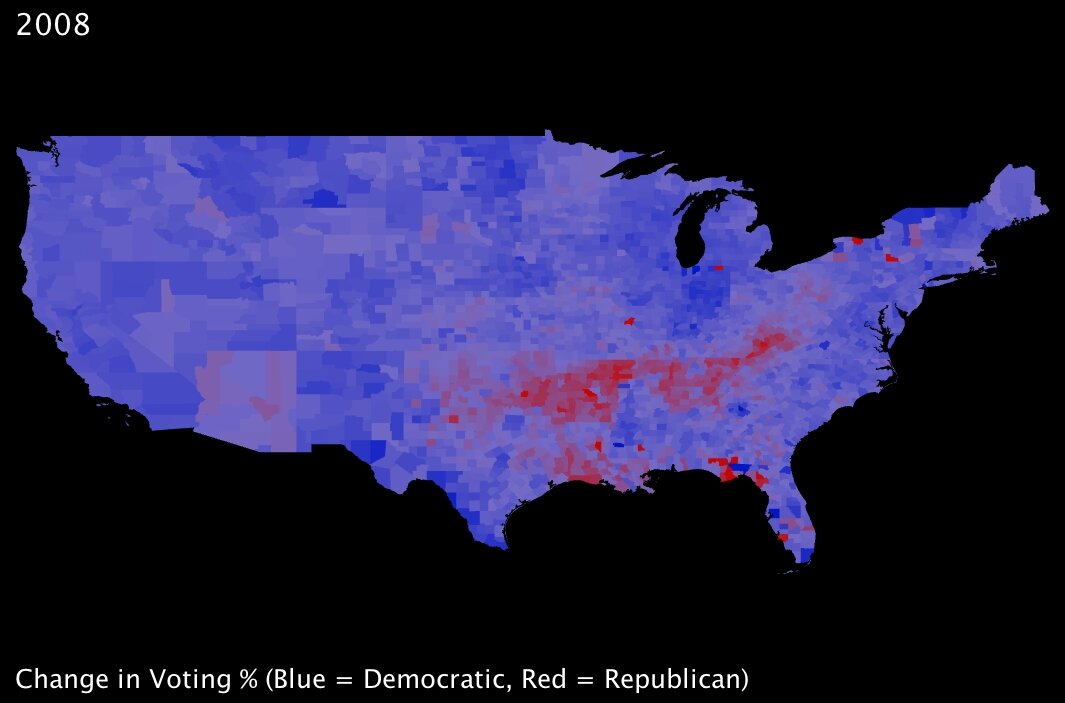
US Unemployment in 2009 - More Job Losses in Production
March 9th, 2009 by George Maasry
In an Economic News Release on Friday, the Bureau of Labor Statistics published their latest unemployment figures, covering the first two months of 20091. Not that it comes as a surprise to anyone, but it was more bad news: more unemployment in virtually every sector of US industry.
|
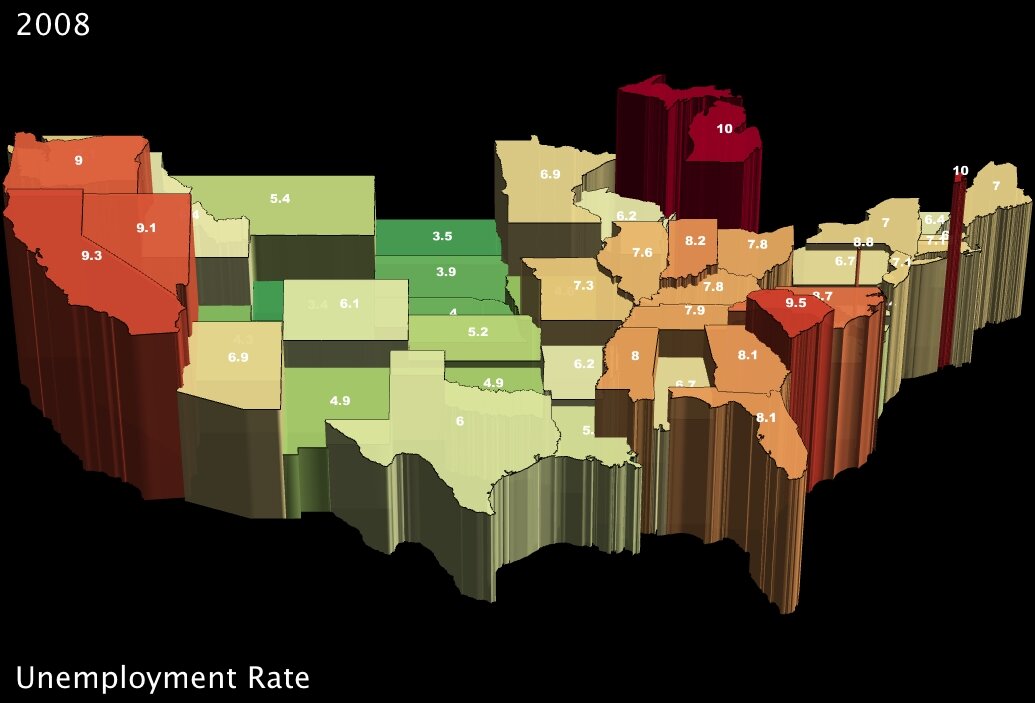
|
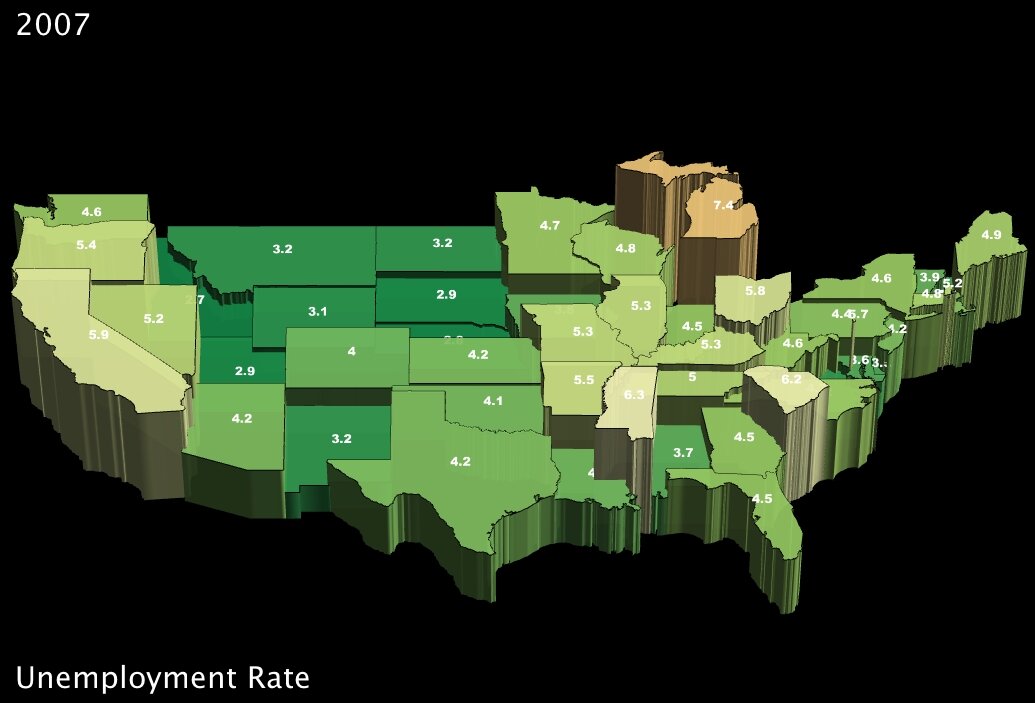
| Unemployment Rate by State in 2007 (click to enlarge) | Unemployment Rate by State in 2008 (click to enlarge) |
The overall negative trend is not consistent across sectors, however. While a few areas have managed to stop hemorrhaging workers, others are proportionally hit so hard that another 3 percent of the entire workforce lost their jobs between December and February of this year. Specifically, the goods-producing sectors (generally construction and manufacturing) are still suffering massive job losses each month; professional and business services were hardest hit by sheer numbers, with 180,000 jobs lost in February; and by contrast, some of the other services-providing sectors have slowed their losses considerably. A minority of services have even seen slight recovery, with government, education and health-sector jobs actually increasing marginally in January and February.
While professional and business services did suffer major losses this past month, the 180,000 jobs lost represent one percent of the national work force in that sector; meanwhile, the 168,000 jobs lost in manufacturing, which compound repeated one-percent-and-greater losses of the workforce the past several months, represent almost 1.5 percent of the work force of January.
To expose some of these differing trends, I took the figures for the last three recorded months — December of ‘08 and January and February of ‘09 — and rescaled them as percentage changes within the workforce for a given sector. I then plugged the data into IBM’s online visualization toolkit, “Many Eyes2,” to create the graph below. You can click the image to interact with it and look at my data (note: I couldn’t get the labels to appear without being clipped, so hover over a bar in the graph to get a complete view of the category name).
The disproportion between industries is striking, indeed. And since the graph is showing percentage change in employment figures, the compounded effect of a dwindling labor force month by month makes each job lost in goods-producing industries count further. It should be noted that in addition, not only are construction and manufacturing establishments shedding employees, but they are also reducing the number of hours on average that their employees are at work, which in turn reduces their wages. According to the BLS’s numbers, the average hours of work reported in manufacturing jobs for December, January and February gradually declined from 39.9 to 39.8 to 39.6 hours1, despite steady averages across all sectors.
–
Taking a closer look at manufacturing…
As UUorld sends its employees between Silicon Valley and Washington DC — areas primarily involved in technology and government, respectively — the immediate effects of failing manufacturing are not always obvious in my everyday experience. Clearly, however, there are parts of the country that rely heavily on manufacturing. I thought it would be useful to include some analysis of regional patterns as the unemployment crisis has affected them.
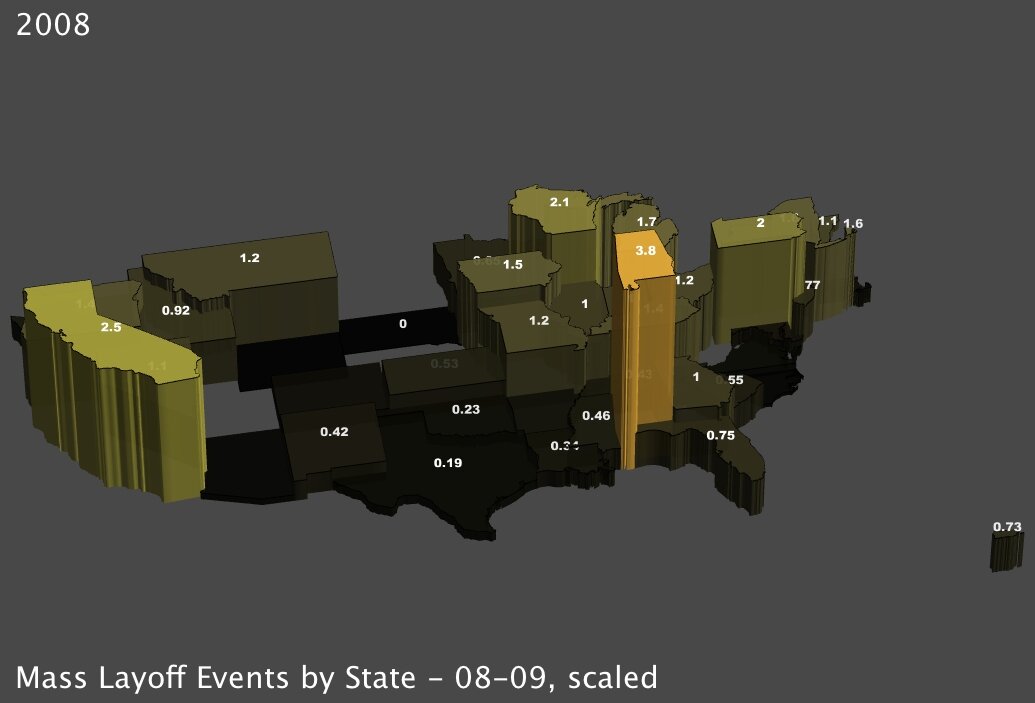
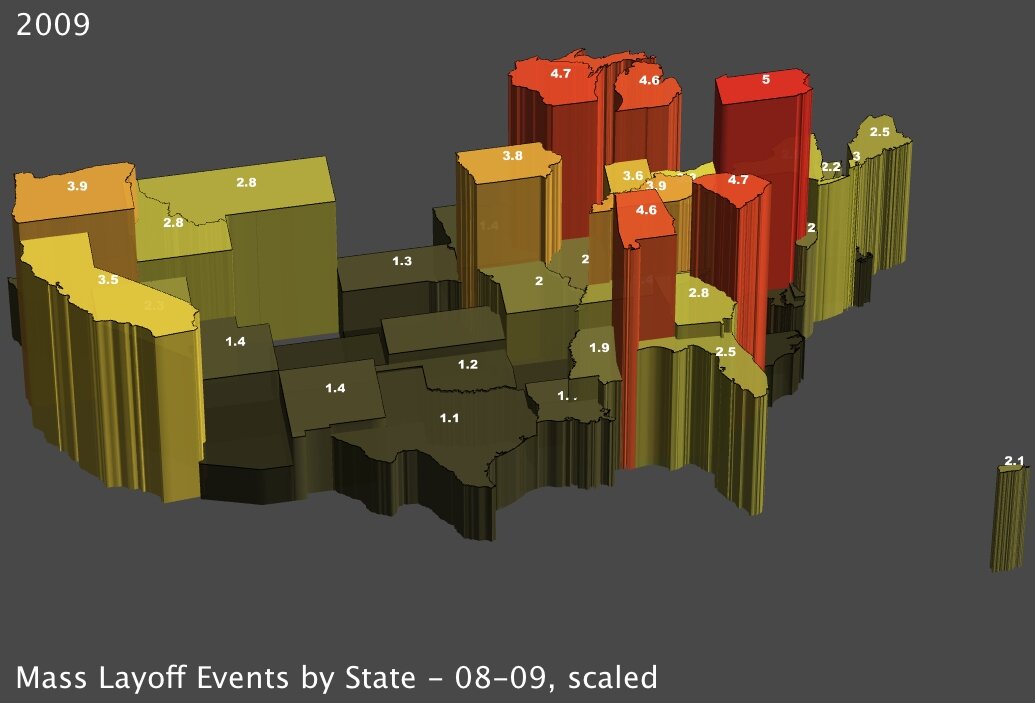
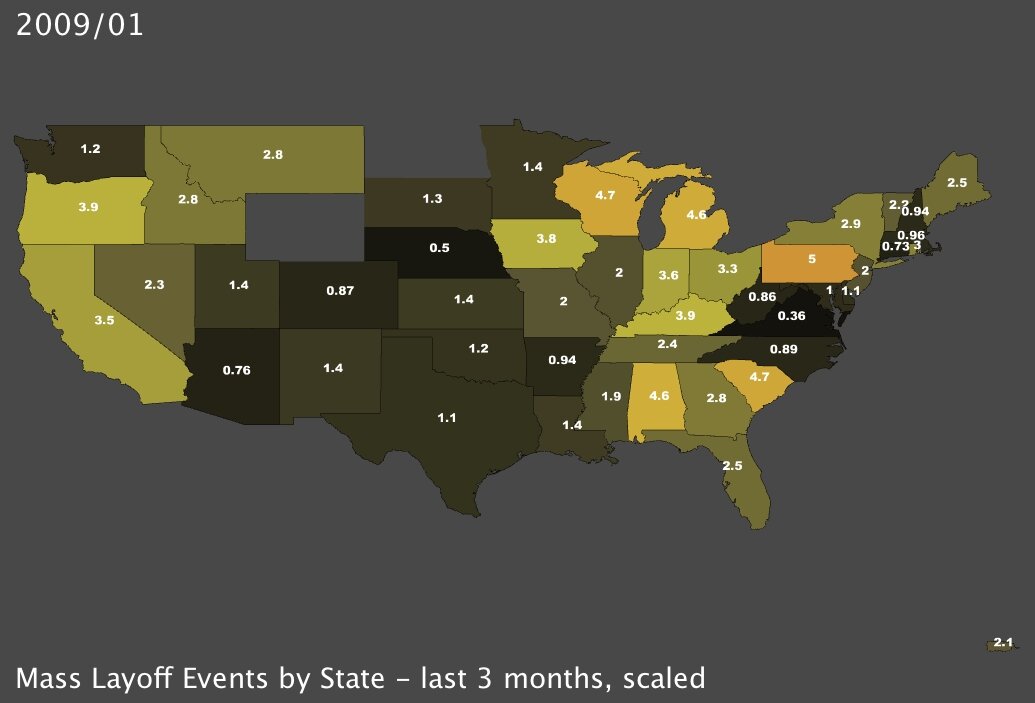
I started by mapping recorded instances of new unemployment, in the form of mass layoff events, measured whenever a company has at least 50 initial claims for unemployment insurance (UI) filed against it during a 5-week period3. The most recent data being the records for January of 2009, I decided to contrast that data with the same measures for January of 2008. The regional trends are immediately identifiable:
|
|
| Mass Layoff Events by State, January 20084 (click to enlarge) | Mass Layoff Events by State, January 2009 (click to enlarge) |
I’ve scaled the data by dividing each state’s number of recorded mass layoffs by every 100,000 members of its labor force. So, for instance in the upper-right image above, Michigan had 4.6 mass layoffs reported for every 100,000 workers in the state this past January. With a total labor force of about 4.9 million, that means that more than 220 mass layoffs occurred in January alone — more than seven per day.
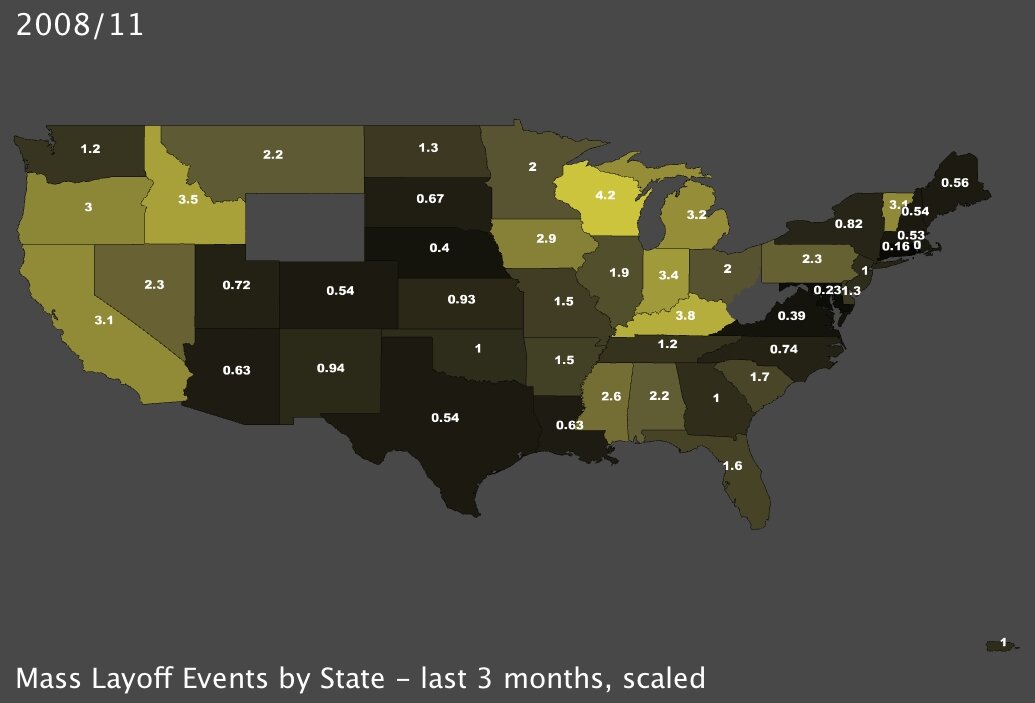
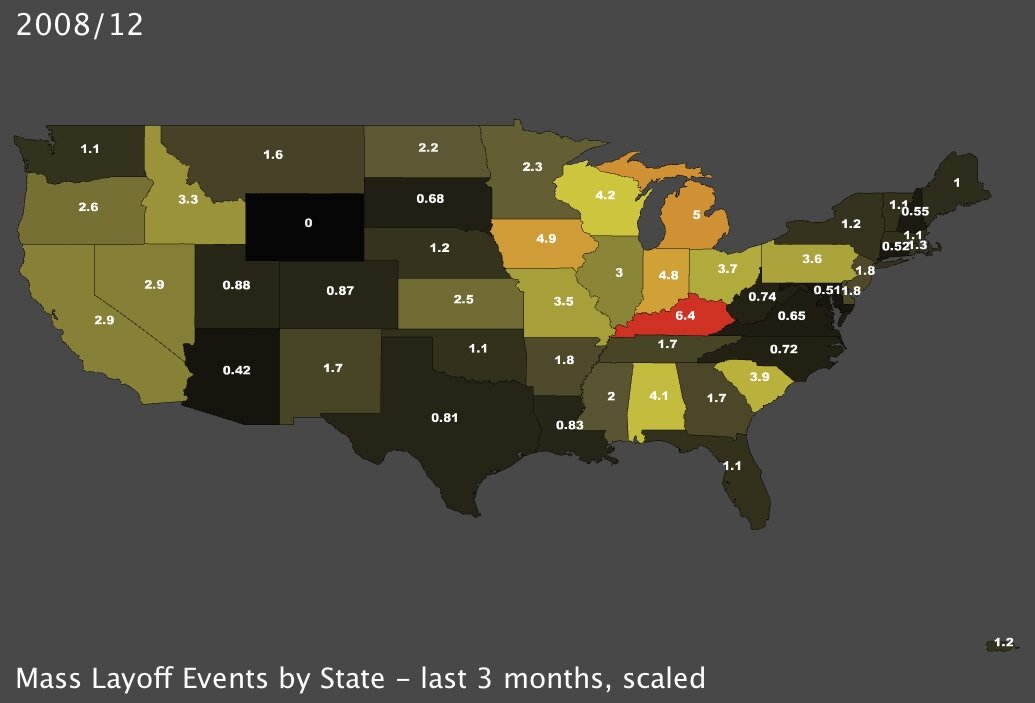
To get an idea of the consistency of these layoffs, I’ve also generated maps for the last three recorded months. The data in the rightmost map below is identical to the January 2009 map above-right, but the colors are scaled relative to the other maps in the set of three. Because Kentucky suffered an enormous number of mass layoffs in December of 2008 (middle map) which surpasses all other measures, there is some diminution of the high values in January 2009. Given that these recordings are separate from month to month, it is all the more shocking to realize that the effects are cumulative. In other words, while Kentucky suffered 6.4 mass layoffs per 100,000 workers in December, the trend didn’t reverse itself in January, which saw the state suffer another 3.9 mass layoffs per 100,000.
|
|
|
| Mass Layoff Events, November ‘08 (click to enlarge) | Mass Layoff Events, December ‘08 (click to enlarge) | Mass Layoff Events, January ‘09 (click to enlarge) |
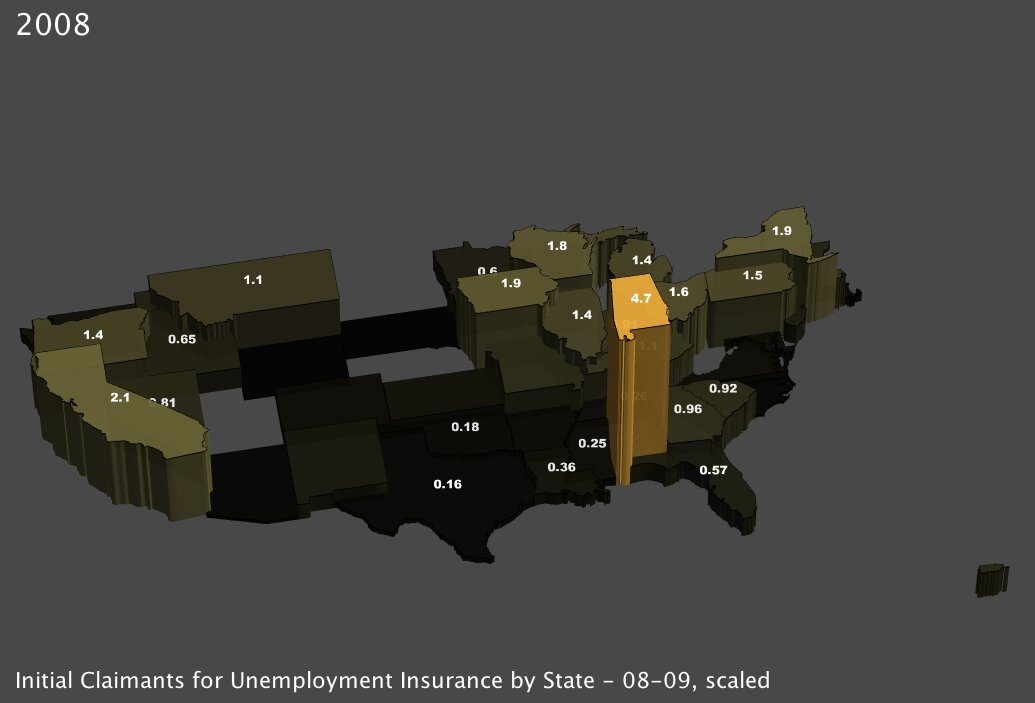
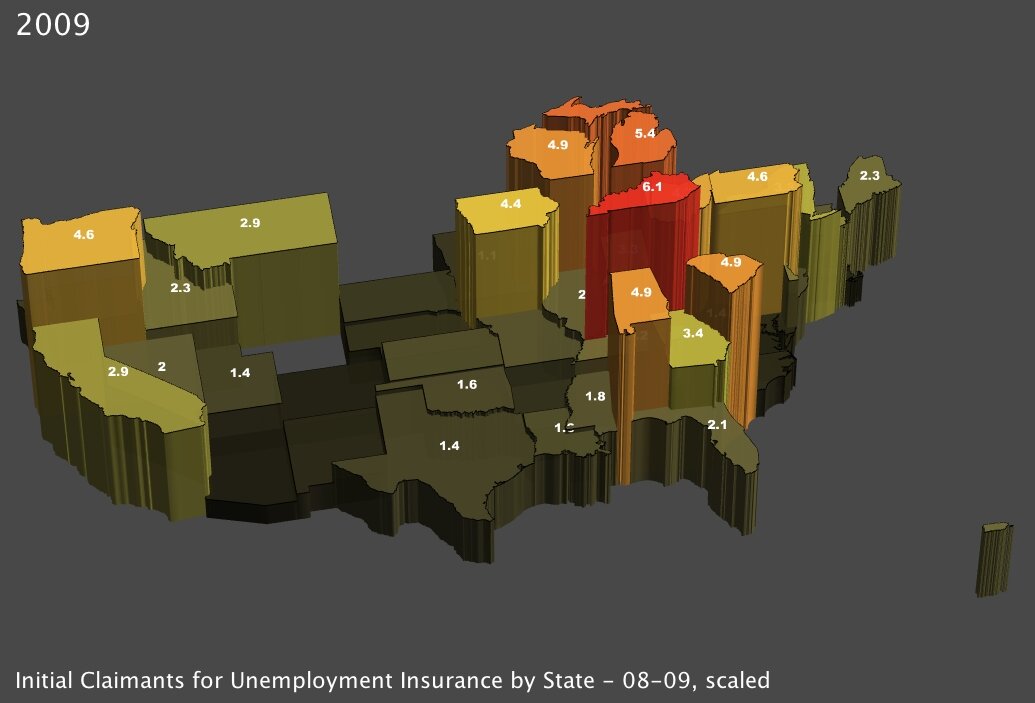
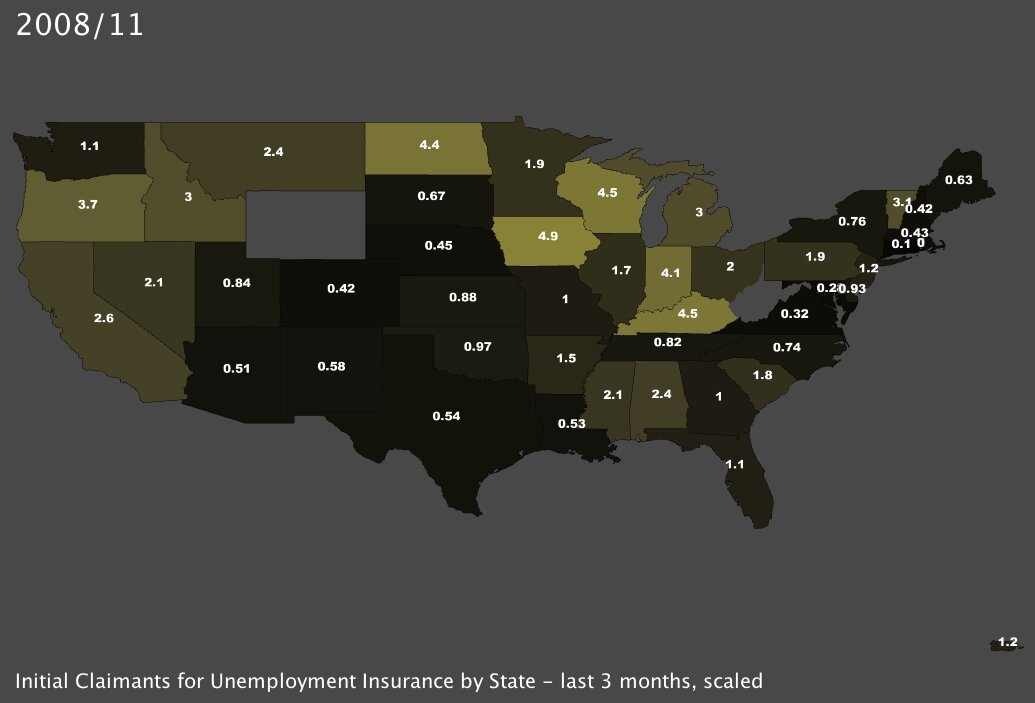
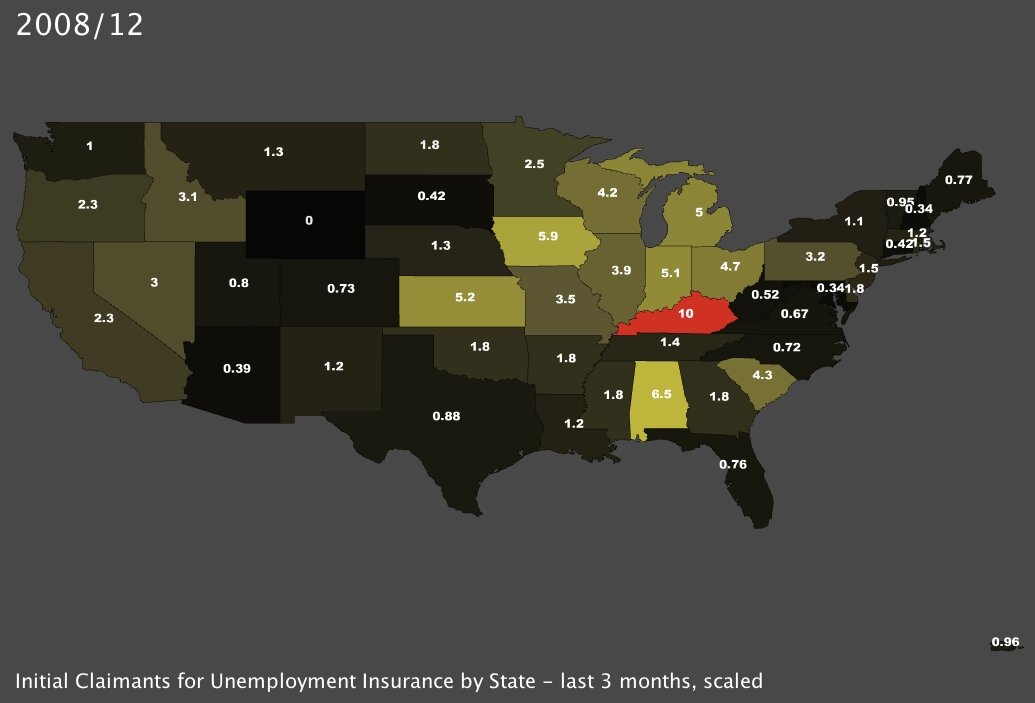
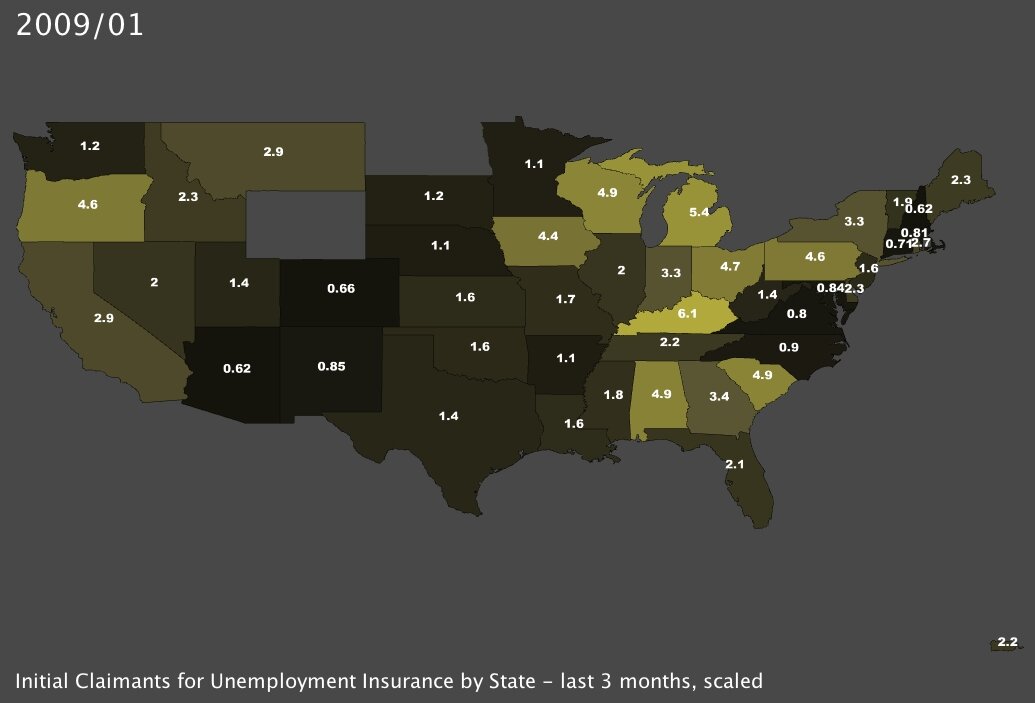
I also made some maps based on the actual total number of claimants3 for UI in a given period of time. The regional patterns are similar, and the rate of new unemployment seems consistent across both time periods as well (the January-to-January comparison and the month-by-month comparison). In this case I scaled the data by dividing by every 1000 members of the labor force; so for example Kentucky saw 10 of every 1000 workers file for unemployment insurance in December of 2008 (the middle small map below).
|
|
| Initial Claimants for Unemployment Insurance, January 2008 (click to enlarge) | Initial Claimants for Unemployment Insurance, January 2009 (click to enlarge) |
|
|
|
| Claimants for UI, November 08 (click to enlarge) | Claimants for UI, December 08 (click to enlarge) | Claimants for UI, January 09 (click to enlarge) |
Across all of the maps, it is obvious that some states are much harder hit than others. In particular, the Great Lakes states and many of those in the Southeast are the worst off. And that is logical, given the recent data published by BLS: many, if not most, of the Great Lakes and Southeastern states rely heavily on manufacturing.
|
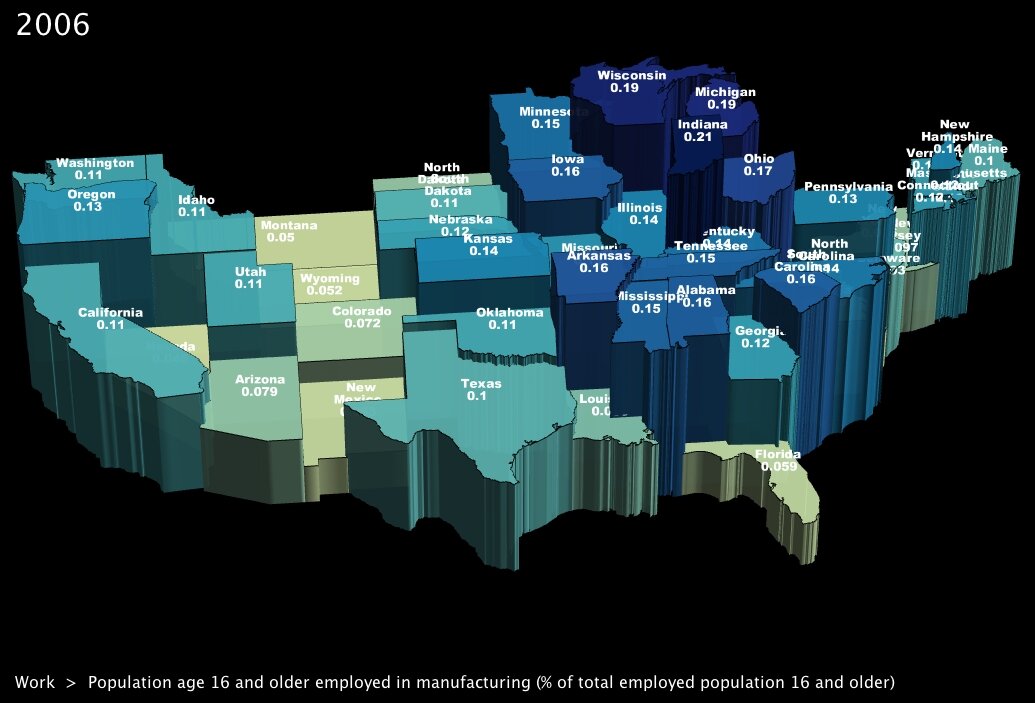
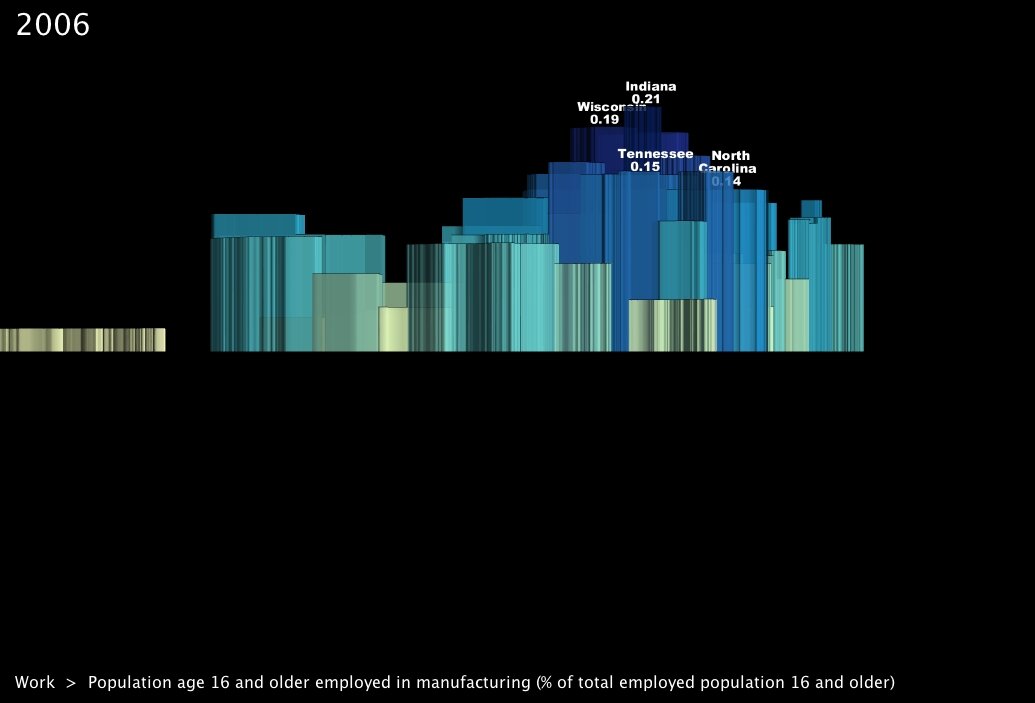
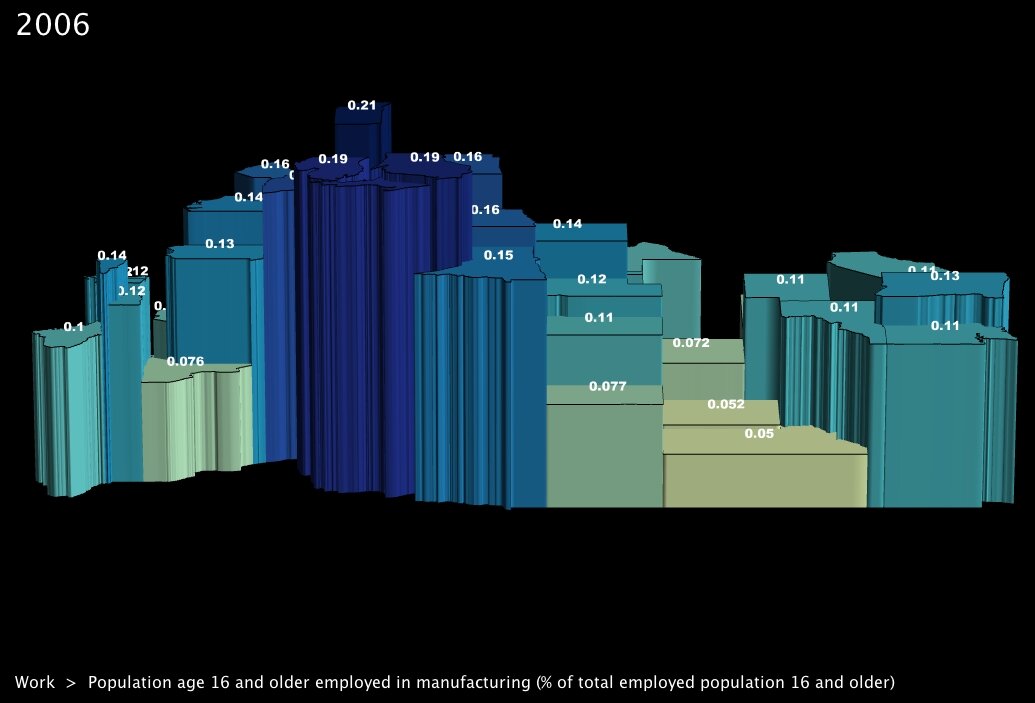
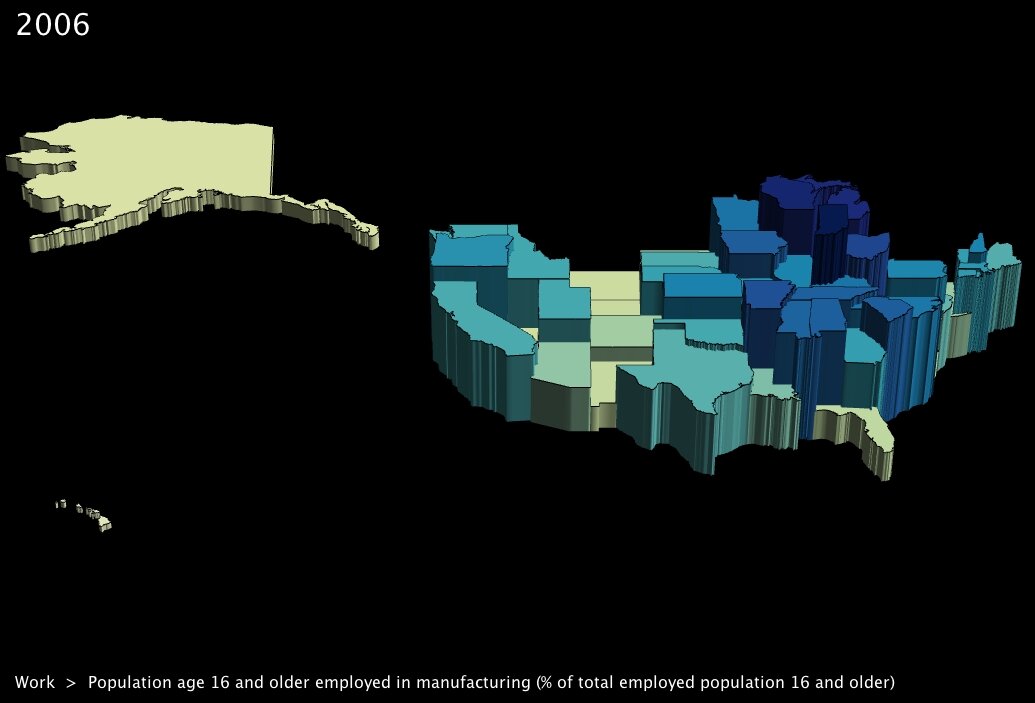
To go one step further, I took the most recent data from the Census Bureau’s American Community Survey5 to get some maps showing exactly which states were most reliant. Of course all of the hard-hit states show up in dark blue: Michigan, Ohio, Indiana and Wisconsin all see close to a fifth of their entire workforce employed in the sector. I took several snapshots from uncommon angles as well, shown in the small maps below. Looking south across the US, one can see how little |
|
| % of Work Force Employed in Manufacturing, by State (click to enlarge) |
of the Rocky Mountain states’ labor force is employed in manufacturing — which corresponds with their relative resistance to job losses in the past few months.
|
|
|
| Claimants for UI, November 08 (click to enlarge) | Claimants for UI, December 08 (click to enlarge) | Claimants for UI, January 09 (click to enlarge) |
What is perhaps surprising in all of this is that, unlike with the housing market or wall street traders, the idea of over-inflated prices self-correcting doesn’t really apply. The school of thought that we should welcome recession as a means of readjusting values to their appropriate levels is somewhat lost on an industry which has actually been in decline for several years running, and which was already suffering — albeit less severely — before the current recession hit.
But even if the recession didn’t cause the problems in manufacturing, it seems that tough economic times have exacerbated the problem. For states in the Rust Belt and states in general that rely heavily on goods-production, GDP has decreased for several years running, and the situation only seems to get worse with time. (Example: ).
| Between 2003 and 2007, the three worst-performing states in GDP growth were Michigan, Indiana and Ohio, all vastly under the national levels (and even averaging recessive growth in the case of Michigan). Nonetheless, through the entire period about a quarter of the GDP generated by those states, and some of those in the Southeast (Kentucky, Louisiana, the Carolinas), has remained tied to the sector. | |
| % of GDP Derived from Manufacturing, by State, 1997-2007 (click to play video) |
Ultimately, is the solution an “industrial revolution,” as called for by some economists today? Or will the recession force the Great Lakes states and others to redistribute their workforce across other sectors? In any event, all appearances seem to indicate that further tough times lie ahead, and preliminary statistics show a further employment slide as we progress through this year. The BLS’s predictions for the years to come indicate similar trends: in their 10-year projections for industry sectors, a large majority of those listed as “most rapidly declining” are directly related to or are subsets of manufacturing6.
It will be interesting to see whether programs like the Obama Stimulus Package can at least slow down the job loss rates in the coming months. We will be watching the release of new statistics closely …
—
Footnotes:
1. Bureau of Labor Statistics. Economic News Release: employment situation summary for February, 2009.
2. research group. Many Eyes online data visualization tool.
3. Bureau of Labor Statistics. Mass layoff statistics program.
4. States that are missing from the maps did not provide data that meets the disclosure standards of either the BLS or local state agency. BLS confidentiality standards.
5. US Census Bureau. American Community Survey. Data available at: UUorld Data Portal.
6. Bureau of Labor Statistics. Employment projections.
